.webp)


When it comes to e-commerce, maximizing revenue and profitability is one of the top goals of any business.
One key metric that businesses track to measure success is Average Order Value (AOV). A higher AOV means customers are spending more per transaction, leading to greater profitability without increasing customer acquisition costs.
In this guide, we’ll explore:
By the time you’re done with this article, you’ll have a clear roadmap for using AOV to improve revenue, profitability, and customer engagement.
What is average order value (AOV)?
Average order value is a key e-commerce metric that measures the average amount a customer spends per order on a website.
It helps businesses understand consumer purchasing behavior and optimize pricing, marketing, and sales strategies.
AOV is important because it:
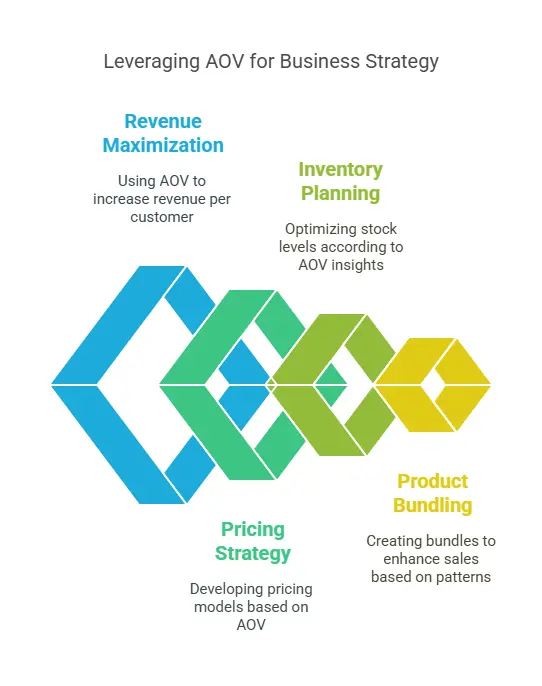
- Helps businesses maximize revenue per customer without increasing acquisition costs
- Guides pricing and discounting strategies
- Influences inventory planning and product bundling decisions
- Provides insights into customer purchasing patterns
Tracking AOV over time allows businesses to identify patterns, refine strategies, and drive revenue growth.
How to calculate AOV
AOV is calculated using a simple formula:
This formula is to determine how much customers typically spend per transaction.
So, for example, if an e-commerce store generates $50,000 in revenue from 1,000 orders, the AOV would be:
This means that, on average, customers spend $50 per order.
Variations in calculation
While the basic formula remains the same, different industries and business models may modify it slightly:
- Subscription businesses: Instead of revenue per order, they may calculate AOV based on monthly billing cycles.
- Wholesale businesses: AOV may be influenced by bulk purchases, making it higher than in standard retail.
- Luxury vs. budget brands: High-end retailers tend to have a higher AOV, whereas discount-based businesses may focus more on purchase frequency.
Tracking AOV in relation to industry benchmarks and business type allows companies to set realistic goals and create better strategies for increasing revenue.
AOV vs. other key e-commerce metrics
While average order value is a vital metric for understanding revenue per transaction, it does not provide a complete picture of business performance on its own.
To get deeper insights, businesses should analyze AOV alongside customer lifetime value (CLV) and purchase frequency.
AOV vs. CLV (customer lifetime value)
AOV measures how much a customer spends per order, while CLV represents the total revenue a business can expect from a customer over their entire relationship with the brand.
A high AOV but low CLV may indicate that customers are spending a lot in a single transaction, but not returning for repeat purchases, signaling a need for better retention strategies.
The basic formula for CLV is:
AOV – The average amount spent per order.
Purchase frequency – How often a customer makes a purchase within a specific time frame.
Customer lifespan – The average duration a customer remains active with the brand.
If a business has:
- An AOV of $50
- A purchase frequency of 5 times per year
- A customer lifespan of 3 years
Then, the CLV would be:
CLV = 50 × 5 × 3 = 750
This means the business can expect to generate $750 in total revenue from the average customer over their lifetime.
📌 Tip: Businesses should focus on both AOV and CLV to maximize long-term profitability, ensuring customers not only spend more per order, but also return for repeat purchases.
AOV vs. purchase frequency
Purchase frequency measures how often customers place orders over a given period, while AOV just focuses on the amount spent per order.
A high AOV but low purchase frequency may indicate that customers are spending a lot in a single transaction but not returning frequently, suggesting the need for better engagement and retention strategies.
The formula for purchase frequency is:
Total orders – The number of purchases made within a given time frame.
Total unique customers – The number of individual customers who placed those orders.
If a business has:
- 10,000 orders in a year
- 2,500 unique customers
Then, the purchase frequency would be:
This means the average customer places four orders per year.
📌 Tip: To increase both AOV and purchase frequency, businesses can implement loyalty programs, subscription models, and personalized offers that encourage repeat purchases.
Why these metrics work together
Instead of relying on AOV alone, businesses should:
Compare AOV and CLV to ensure customers are returning and contributing long-term revenue.
Use purchase frequency alongside AOV to measure how often customers buy and how much they spend per order.
Adjust marketing and pricing strategies to optimize all three metrics for sustained revenue growth.

Strategies to increase average order value
Boosting average order value is one of the most effective ways to increase revenue without acquiring new customers.
Below are proven strategies to increase AOV, ranging from customer segmentation to pricing and marketing tactics.
Segmenting AOV by customer cohorts
Understanding how different customer groups spend money allows businesses to create targeted strategies to increase AOV.

Implementation examples:
- Loyal customers: Offer exclusive discounts or bundle deals to increase their purchase size.
- New customers: Encourage them to spend more with first-time purchase incentives.
- Infrequent buyers: Use retargeting campaigns to drive larger repeat purchases.
📌 Tip: Businesses can use A/B testing on different cohorts to determine which promotions drive the highest AOV increases.
Leveraging AOV for pricing and product strategy
Strategic pricing and product bundling can encourage customers to spend more per transaction, ultimately boosting AOV. Structuring offers in a way that makes larger purchases more attractive and valuable can increase revenue without relying solely on discounts.
- Bundles: Group complementary products together at a slightly discounted rate to encourage higher spending (such as a skincare box set instead of individual products).
- Upsells: Suggest higher-tier products or add-ons at checkout (like upgrading a regular subscription to a premium plan).
- Cross-sells: Recommend related products based on the customer’s cart (such as phone cases when purchasing a smartphone).
How pricing adjustments impact AOV
If you’re looking at other ways to entice customers outside of your products themselves, these are some other ways to get their attention:
- Volume discounts: Offer discounts for bulk purchases, incentivizing customers to buy more per order.
- Free shipping thresholds: Encourage higher spending by setting a minimum purchase requirement for free shipping.
- Psychological pricing: Use pricing strategies like charm pricing ($49.99 vs. $50) or value-based pricing to increase perceived value.
Boosting AOV with geotargeting strategies
Personalized shopping experiences drive higher spending, and geo-targeting is a powerful way to personalize offers based on a customer’s location.
Instead of using a one-size-fits-all approach, businesses can deliver region-specific promotions, adjust pricing dynamically, and create localized messaging to encourage larger purchases.
How Geo Targetly can help increase AOV
Geo Targetly offers a set of geotargeting tools designed to optimize customer engagement and drive higher order values. Here’s how businesses can level up with these features:
- Geotargeted promotions: Show region-specific discounts or special offers based on a visitor’s location, increasing purchase incentives.
- Localized pricing: Automatically adjust prices to match local currencies, taxes, or market conditions, reducing friction in the buying process.
- Personalized product recommendations: Highlight best-selling or trending products in specific regions, making recommendations more relevant and increasing add-on purchases.
- Geo redirects: Direct visitors to the correct country-specific version of a website, ensuring they see accurate inventory, prices, and promotions.
- Dynamic content: Customize banners, pop-ups, and call-to-action buttons based on location to create a more personalized shopping experience.
Geo-targeting transforms the way businesses interact with their customers, increasing relevance, engagement, and ultimately, AOV.
Take control of your localization strategy and boost revenue by delivering the right message to the right audience at the right time.
Ready to get started? Try Geo Targetly today and unlock the power of location-based personalization!
Using AOV to enhance customer lifetime value (CLV)
Average order value is a key factor in customer lifetime value CLV, which represents the total revenue a business can expect from a customer over time.
Since CLV is calculated using AOV, increasing how much customers spend per order can massively improve long-term profitability.
A higher AOV means:

How to adjust marketing budgets based on AOV insights
- Higher AOV customers: Invest more in retargeting, loyalty programs, and personalized experiences to maintain engagement and encourage repeat purchases.
- Lower AOV customers: Use bundling, volume discounts, or minimum spend incentives to encourage higher spending per order.
- Subscription-based businesses: Analyze AOV trends to optimize pricing strategies, renewal offers, and retention efforts for long-term profitability.
📌 Tip: Businesses can use AOV data to allocate marketing spend more efficiently, focusing efforts on the most profitable customer segments.
Using AOV in marketing attribution models
Marketing attribution models reveal which channels and strategies attract the most valuable customers. Integrating AOV into these models highlights the marketing efforts that generate higher-spending customers, allowing businesses to refine ad spend for better returns.
Evaluating channel performance based on AOV
Not all marketing channels contribute equally to revenue. Some drive high traffic but low AOV, while others bring in fewer customers who spend more per order.
Example comparisons:
- Organic search might bring steady, high-AOV customers who are actively searching for premium products.
- Social media ads might generate more impulse buys, but lower average order values.
- Email marketing could nurture repeat customers, leading to higher AOV over time.
Investing in channels that yield higher AOV conversions
Businesses should analyze AOV by acquisition channel and adjust their marketing budgets accordingly:
Prioritize high-AOV channels: Increase investment in marketing channels that bring customers who spend more per order.
Optimize low-AOV channels: Introduce bundling, upsells, or free shipping incentives to encourage higher spending from low-AOV traffic.
Personalize ad targeting: Segment audiences based on past AOV behavior and tailor offers to maximize order value.
📌 Tip: Businesses should continuously test and refine attribution models to ensure ad spend is being allocated to the most profitable channels.
Monitoring and analyzing AOV trends over time
Tracking AOV trends over time lets businesses identify patterns, adjust pricing strategies, and optimize marketing efforts based on customer behavior.
Seasonal changes, economic shifts, and marketing campaigns all influence how much customers spend per order.
How seasonal fluctuations affect AOV
Certain times of the year naturally lead to higher or lower AOV depending on industry trends.
- E-commerce and retail: AOV typically spikes during holiday sales (Black Friday, Christmas) due to bulk purchases and gift-buying.
- Hospitality and travel: Higher AOV during summer and peak travel seasons when people book premium services.
- Subscription businesses: AOV may drop during economic downturns as consumers cut unnecessary spending.
Using monthly AOV trends to adjust inventory and marketing
Businesses should analyze monthly AOV trends to make data-driven decisions:
Increase ad spend and promotions during high-AOV months to maximize revenue.
Adjust inventory levels based on historical seasonal spikes.
Introduce discounts or bundling strategies during slow periods to maintain a steady AOV.
📌 Tip: Create AOV trend reports to compare month-over-month performance and forecast optimal pricing and marketing adjustments.
Advanced A/B testing focused on AOV
A/B testing serves as a popular and highly effective method for optimizing average order value, allowing businesses to experiment with pricing, product recommendations, and upsell strategies.
Controlled tests reveal which changes drive higher spending per transaction, enabling data-driven decisions.
Testing product recommendations and upsells
Businesses can test different recommendation placements and upselling tactics to encourage larger purchases.
Examples of A/B tests:
- Upsell placement: Compare AOV results when upsell offers are placed on the product page vs. the checkout page.
- Cross-sell offers: Test whether bundling related items (like laptop + accessories) increases AOV.
- Personalized recommendations: Show AI-driven product suggestions vs. manually selected recommendations.
Optimizing discount structures and incentives
Not all discounts increase AOV – some may actually reduce spending per transaction. A/B testing helps businesses find the right balance.
Key discount tests:
Threshold-based free shipping: Does setting a $75 minimum for free shipping increase AOV?
Percentage vs. fixed discounts: Do customers spend more when given $10 off vs. 10% off?
Loyalty program perks: Do exclusive members-only discounts lead to higher AOV?
Measuring results and iterating
After running A/B tests, businesses should analyze:
📌 Tip: Continuously test different elements of pricing, product placement, and incentives to find the most effective ways to increase AOV without sacrificing margins.
Industry benchmarks for AOV
Understanding average order value benchmarks helps businesses set realistic goals and compare their performance against competitors.
AOV varies by industry, influenced by factors such as product pricing, customer purchasing behavior, and sales strategies.
Expected AOV ranges by industry
According to Dynamic Yield, the AOV globally is $136 as of January, 2025.
Here are some other current industry benchmarks:
How businesses can use benchmarks to set goals
Goals are always better when they have solid, tangible parameters to meet or compare to. To get a better understanding of your current position and future goals, consider the following:
- Compare AOV to industry standards. If your AOV is below average, it may indicate pricing or product bundling opportunities.
- Adjust marketing and pricing strategies. Businesses in high-AOV industries (like luxury goods) may benefit from VIP upselling, while lower-AOV industries (beauty or household items, for example) might focus on bundling smaller items.
- Monitor AOV over time. Tracking AOV against industry trends can reveal growth opportunities and seasonal shifts.
📌 Tip: AOV benchmarks should be used alongside other metrics like purchase frequency and customer lifetime value to get a full picture of performance.
Conclusion
Average order value plays a major role in e-commerce, influencing revenue, marketing efficiency, and long-term profitability.
While customer acquisition remains important, increasing AOV allows businesses to grow revenue without raising acquisition costs.
Optimizing how much customers spend per order creates opportunities for higher profitability, better retention, and stronger marketing performance.
Key takeaways for increasing AOV
Monitor and analyze AOV trends: Identify seasonal fluctuations, track customer spending patterns, and focus on high-value segments.
Refine pricing and product strategies: Use bundling, upselling, and free shipping incentives to encourage larger purchases.
Improve marketing attribution: Focus investment on channels that drive high-AOV conversions for better ROI.
Continuously test and optimize: Run A/B tests on product recommendations, pricing structures, and checkout processes to determine the most effective strategies.
Benchmark performance against industry standards: Compare AOV to competitors and set achievable goals based on market trends.
Strategic AOV improvements boost revenue, foster customer loyalty, and maximize the impact of marketing efforts.
Businesses that prioritize data-driven decision-making and smart pricing strategies are sure to gain a competitive edge in the evolving e-commerce landscape.
Improve your average order value by boosting conversion with Geo Targeted content in just a few clicks with no installation required.

Copywriter